
Now with jState - a Javascript simulation extension interface.
![]() jState Overview...
jState Overview...
The Crossware ARM simulator creates a virtual ARM chip that runs on your PC. It allows ARM programs to be run without any hardware.
It shares a common user interface with the debugger and many of the simulator and debugger features are identical.
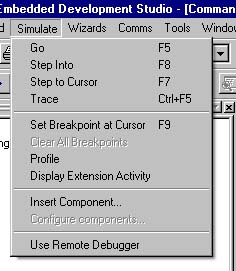
The simulator can be run from the simulate menu as shown on the left, by clicking on items in the simulator tool bar or by using the keyboard accelerator keys.
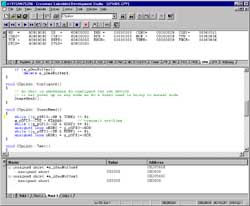
Below is an image of a program being executed in the simulator. Click on it to see an enlarged image.
The simulator shares the following features with the debugger:
The following features are specific to the simulator:
You can open multiple views and watch all memory areas, setting breakpoints when memory locations are written, read or both. Coloured highlighting shows you which locations are changing and optionally you can enable data coverage so that you can clearly see which memory locations have been accessed and which have not. You can edit any memory location in hexadecimal or ASCII format.
You can open up to five watch windows to display and edit the values of your C, C++ and assembler variables. One of these watch windows will automatically display local variables and be automatically updated as variables move in and out of scope. The other four can display global and local variables of your choice. You can freeze the contents of a watch window to prevent it from being updated by the simulator. This feature allows you to compare historic and current values of your variables.
There is a register view for the ARM core registers and register views for the on-chip peripherals. Multiple register views can be open simultaneously. If the mouse hovers over a register value a tooltip will pop up displaying the name of the register and listing the names of any bitfields together with the value of the bits.
The disassembly view displays the disassembled machine code and allows single stepping at the machine code rather than the source code level. Disassembly mode can be optionally selected and will be the default for programs for which there are no debug records. The simulator will flip into disassembly mode if execution is halted at a point at which no source code is available. The disassembly view will show the source code interspersed with disassembled code if source code is available for the address range being disassembled.
Breakpoints can be set on source code lines and will be translated by the simulator into a program counter location breakpoint.
Breakpoints can be set on C/C++ variables and will be translated by the simulator into a memory location breakpoint.
Both types of breakpoint can be combined together in a complex heirarchy. Execution will halt at the top level breakpoint when all of the conditions of lower level breakpoints have been met.
Machine level breakpoints are set in the simulator and allow breakpoints at arbitrary memory locations and at arbitrary program counter locations.
The call stack allows you to follow the progress of your program through the layers of function calls. The call stack window shows the name of each active function, and the values of the program counter, stack pointer and the source code line number reached in each function. You can navigate through the functions in the call stack - double clicking on the function name in the call stack window will take you to the location in your source code reached in that function.
Variable tooltips allow the type, value and location of a variable or symbol to be viewed without a watch window. If the mouse cursor remains stationary for more than half a second over a variable or symbol in a source code window a small window pops up to display this information.
Multiple applications can be loaded into the simulator. This is particularly useful for instance when developing both a boot-loader and an application which is to be loaded by the boot loader.
The simulator is able to associate the debugging information for each application with its location in memory. The appropriate debug records will be selected depending on the value of the program counter and so for instance stepping from one application into another will result in a switch of debugging information. The information displayed in watch windows and source views will therefore always be relevent to the currently active application.
To simulate an ARM or Cortex M3 instruction, the memory bytes at the program counter location (the instruction) are read and interpreted. The simulator then does whatever the real hardware would do with this instruction such as modify the value of a register, load data from memory, store data in memory, modify the program counter in accordance with branching conditions.
An application is simulated one instruction at a time starting with the conditions present at reset.
The behaviour of many of the on-chip peripherals of a variant are simulated.
This is done by keeping track of writes and reads to and from a peripherals memory areas and by responding to the incrementing cycle count in the appropriate way.
The interrupt controller is also an on-chip peripheral and is simulated.
A simulating peripheral can trigger an interrupt in the interrupt controller and the interrupt controller will then trigger an interrupt in the ARM core. The simulating ARM core will respond to the interrupt and execution will transfer to the appropriate interrupt vector address. Execution of the peripherals interrupt handler should then follow (providing the program has been correctly written).
It is possible to extend the simulator with custom DLLs (dynamic link libraries) written in C or C++. Such extensions can keep track of writes and reads to memory, respond to the incrementing cycle count and also interact with the simulating on-chip peripherals.
If a simulating on-chip peripheral for instance writes to a port pin, the custom extension can respond to this in an appropriate way.
Alternatively if a simulating on-chip peripheral for instance reads a port pin, the custom extension can provide the value of this pin and so influence the behaviour of the on-chip peripheral.
This Virtual Workshop Interface was first introduced for the 8051 in 1998 and the original of an article published in the August 2000 edition Circuit Cellar describes the process of simulating a complete target system:
The Crossware ARM Virtual Workshop Interface is slightly different because ARM is a 32-bit chip. However the basic principles are still the same.
At an point during the simulation process, the ARM core simulator has a complete record of the values of memory and registers and the on-chip peripheral simulators have a complete record of the simulation state of the peripherals.
The state capture facility allows all of this information to be saved. This saved information can then be used to restore the simulator to the state at which the information was captured.
This allows simulation to be viewed and/or restarted at any of the saved states.
As the simulator runs your program, it can optionally capture information about the execution history. It can use this information to produce an execution profile of your source code. This will tell you how much time your program spent executing in the different parts of your code. The profile results are listed in a text window, sorted in accordance with your selected criteria. A double click on a listed item will take you to the relevant line of your source code.
The information captured during execution can also be used to provide a coverage analysis. Code coverage will show you which parts of your code have been executed and which have not. Data coverage will show you which memory locations have been accessed during execution.
The status line contains three cycle counters. One of these displays the number of cycles executed since the start of the program, another displays the number cycles executed since the last command was issued (such as Step, Trace or Go). The third is a trip counter and displays the number of cycles executed since you last reset it to zero.