
The Crossware ARM debugger downloads and runs your program on an ARM target board.
It shares a common user interface with the simulator and many of the simulator and debugger features are identical.
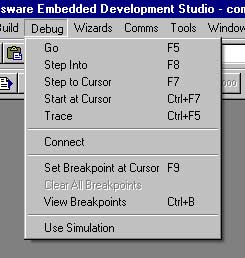
The debugger can be run from the debug menu as shown on the left, by clicking on items in the debugger tool bar or by using the keyboard accelerator keys.
The debugger requires a connection to the target board and this is provided by the Crossware USB JTAG interface Jaguar.
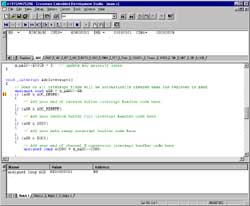
Below is an image of a program being executed in the debugger. Click on it to see an enlarged image.
The debugger shares the following features with the simulator:
The following features are specific to the debugger:
You can open multiple views and watch all memory areas. Coloured highlighting shows you which locations are changing and optionally you can enable data coverage so that you can clearly see which memory locations have been accessed and which have not. You can edit any memory location in hexadecimal or ASCII format.
You can open up to five watch windows to display and edit the values of your C, C++ and assembler variables. One of these watch windows will automatically display local variables and be automatically updated as variables move in and out of scope. The other four can display global and local variables of your choice. You can freeze the contents of a watch window to prevent it from being updated by the debugger. This feature allows you to compare historic and current values of your variables.
There is a register view for the ARM core registers and register views for the on-chip peripherals. Multiple register views can be open simultaneously. If the mouse hovers over a register value a tooltip will pop up displaying the name of the register and listing the names of any bitfields together with the value of the bits.
The disassembly view displays the disassembled machine code and allows single stepping at the machine code rather than the source code level. Disassembly mode can be optionally selected and will be the default for programs for which there are no debug records. The debugger will flip into disassembly mode if execution is halted at a point at which no source code is available. The disassembly view will show the source code interspersed with disassembled code if source code is available for the address range being disassembled.
Breakpoints can be set on source code lines and will be translated by the debugger into a program counter location breakpoint.
Breakpoints can be set on C/C++ variables and will be translated by the debugger into a memory location breakpoint.
Both types of breakpoint can be combined together in a complex heirarchy. Execution will halt at the top level breakpoint when all of the conditions of lower level breakpoints have been met.
Machine level breakpoints are set in the debugger and allow breakpoints at arbitrary memory locations and at arbitrary program counter locations.
The call stack allows you to follow the progress of your program through the layers of function calls. The call stack window shows the name of each active function, and the values of the program counter, stack pointer and the source code line number reached in each function. You can navigate through the functions in the call stack - double clicking on the function name in the call stack window will take you to the location in your source code reached in that function.
Variable tooltips allow the type, value and location of a variable or symbol to be viewed without a watch window. If the mouse cursor remains stationary for more than half a second over a variable or symbol in a source code window a small window pops up to display this information.
Multiple applications can be loaded into the debugger. This is particularly useful for instance when developing both a boot-loader and an application which is to be loaded by the boot loader.
The debugger is able to associate the debugging information for each application with its location in memory. The appropriate debug records will be selected depending on the value of the program counter and so for instance stepping from one application into another will result in a switch of debugging information. The information displayed in watch windows and source views will therefore always be relevent to the currently active application.
The debugger knows the location of RAM and on-chip flash memory for the selected variant. If it is downloading to a memory location that is in these regions then it is able to do so without additional information.
The debugger knows about the external memory interface (if present) for the selected variant. It will need to know how this external memory interface should be configured and this is done via a script file. The simulator can automatically generate a script file for the debugger to use.
By default, the debugger uses hardware execution breakpoints for locations in flash and read-only memory. There are only two hardware breakpoints on the ARM7 debug module. One of these is required for single stepping leaving only one for general use.
For programs executing in RAM, a single hardware breakpoint can be used to provide an unlimited number of software breakpoints. Breakpointed instructions in the program are modified so that they will trigger the hardware breakpoint mechanism whenever it's pattern appears on the bus.
Similary in flash memory, the user can optionally enable software flash memory breakpoints. Breakpointed instructions are then modified in a similar way to RAM breakpoints. To achieve this, the flash page or sector must be completey rewritten whenever the breakpoint is inserted or removed.